Smerdoff
Smerdoff / Custom Software

A Business Intelligence Dashboard Built Around Your Actual Metrics

Generic BI tools ship with dashboards for a business that isn't yours. We build a dashboard around the KPIs your leadership actually reviews — trends, cohort retention, and the numbers that drive decisions — connected directly to your own data sources.

Executive KPIsTrend AnalysisCohort RetentionLive Data Sync
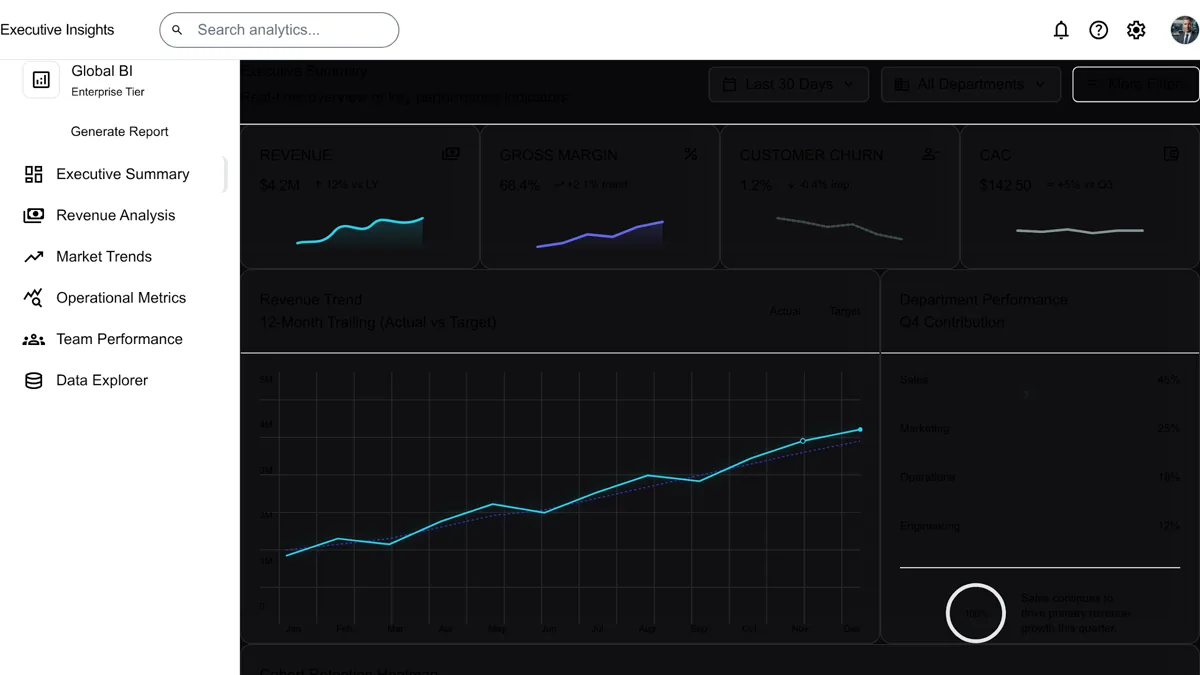
Executive business intelligence dashboard showing KPI trends and cohort retention charts
10–30%
of a full build is what a lean first version typically costs — validate before you commit
MVP cost research
9.4 hrs
saved per employee each week just by connecting the tools a business already uses
Zapier

Why a custom dashboard beats a generic BI tool

Off-the-shelf BI platforms are built to be generic. Your business isn't.

Built around your real KPIs

Shows the metrics your leadership actually tracks, not a generic template you have to reconfigure yourself.

No per-seat licensing

One build instead of a recurring fee for every executive who needs a login.

Connects to your actual data

Pulls directly from your database, CRM, or product analytics — no manual exports or spreadsheet gymnastics.

Cohort retention, done properly

See how each customer cohort behaves over time, not just a single aggregate retention number.

Fast enough for daily use

Built for your data volume specifically, so it doesn't lag the way generic tools do at scale.

You own it outright

No vendor lock-in or forced migration when a BI platform changes its pricing tiers.

What goes into a custom BI dashboard

Built around the decisions your leadership team actually needs to make.

Executive KPI overview

The handful of numbers leadership checks first, front and center, updated automatically.

Trend visualization

Revenue, usage, and growth trends over time, with the ability to drill into any period.

Cohort retention analysis

Track how different customer cohorts retain and churn over their lifecycle, not just overall averages.

Live data connections

Direct integration with your database, CRM, or analytics stack, refreshed on a schedule you control.

Role-based views

Different dashboards or permission levels for executives, managers, and analysts.

Export and reporting

One-click exports for board decks and investor updates, pulled straight from live data.

FAQ

Mainstream BI platforms are capable, but they come with per-seat licensing, a learning curve for building views, and a generic interface you have to configure to match your business. A custom dashboard is built around your specific KPIs from day one, with no license fees per executive who needs access.

Yes — cohort retention is one of the most requested views we build, tracking how groups of customers acquired in the same period behave over time rather than relying on a single blended retention number.

Directly from your existing systems — your production database, CRM, billing platform, or product analytics tool — connected through a live sync rather than manual CSV exports.

A focused dashboard covering your core executive KPIs and one or two deep-dive views, like cohort retention, typically launches in 3-5 weeks.

Related

Get a free estimate for your BI dashboard

Tell us which KPIs and data sources matter most — we'll scope a dashboard built around what your leadership actually needs to see.